

The average mid-size general contractor runs 4–8 active projects simultaneously. Each project has...
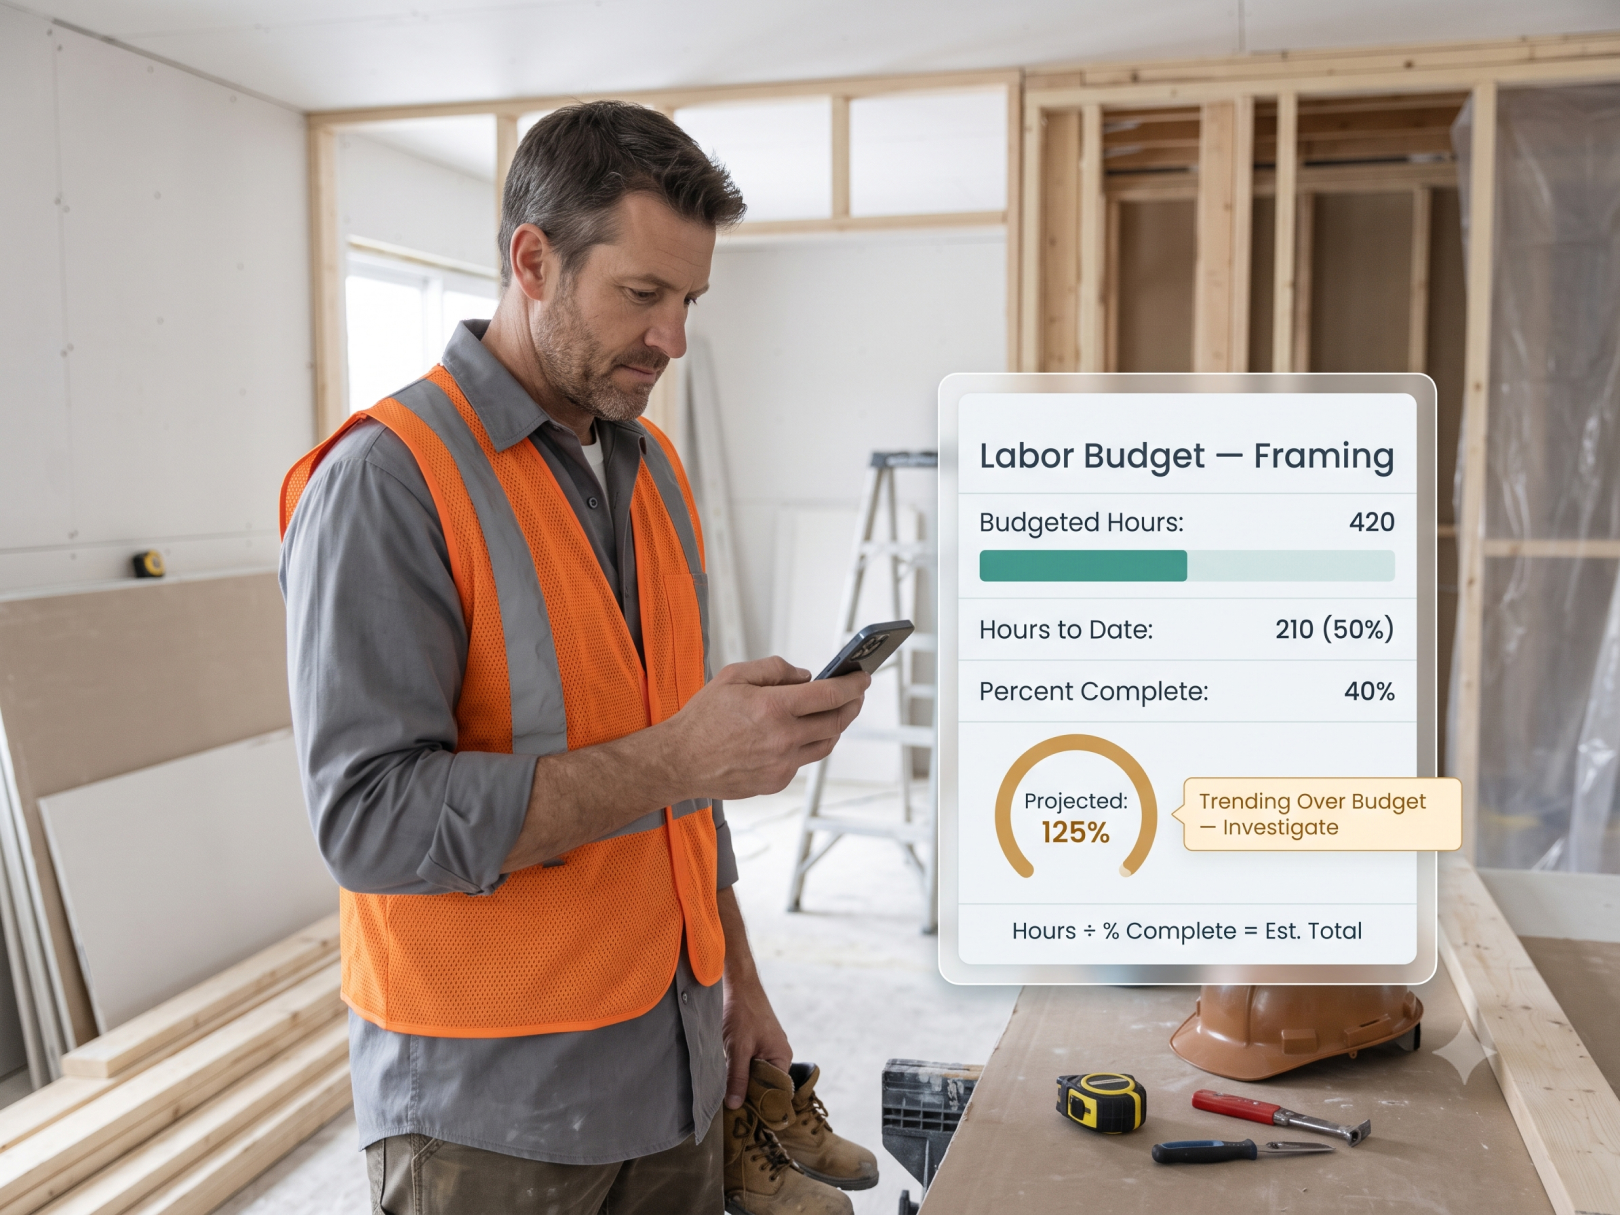 Labor is the single largest cost variable on most construction projects — typically 30–50% of total project cost, entirely dependent on how many hours your crew actually works vs. how many hours you estimated. Unlike material costs, which are locked in when you place the order, labor cost accumulates every day the project runs. A crew that's 15% less productive than your estimate doesn't just create a budget problem — it creates a compounding budget problem that gets worse every week until you catch it.
The construction industry loses an estimated $177 billion annually to project cost overruns, according to McKinsey's 2023 Global Infrastructure report. Labor overruns — crews taking longer than estimated to complete scope — are the single largest contributor. The frustrating part: most labor overruns are detectable within the first 20% of a project's duration. They're almost never detected that early, because most contractors aren't tracking labor costs in real time.
A contractor using paper timesheets or end-of-week manual entry is working with labor cost data that's 5–10 days old by the time it reaches a job cost report. By the time the overrun is visible, three more weeks of work have happened at the same productivity rate. The project is already over budget before anyone knew there was a problem.
Construction time tracking software that connects field clock-ins to job cost reports in real time changes that equation entirely. This guide covers how real-time labor tracking catches overruns early, how to set up the budget-vs.-actual system that makes it work, and what the actual financial impact looks like on a typical project.
If you’re new to structured cost tracking, start with this foundational Construction Project Management Guide to understand how labor control fits into overall project financial health:
Why Labor Cost Overruns Happen
.jpg?width=600&height=450&name=2%20(40).jpg)
Root Cause 1: The Estimate Was Wrong
Every estimate makes assumptions about labor productivity — how many hours to frame 1,000 square feet, how many hours to set a cubic yard of concrete, how many hours per linear foot of conduit. Those productivity assumptions come from historical data, industry standards, or experience.
When actual productivity diverges from the estimate — because the scope was more complex than anticipated, because the crew was less experienced, because site conditions slowed the work — the overrun begins immediately. Without real-time tracking, you don't see it until it's already large.
A structured construction job costing system helps prevent this disconnect:
Root Cause 2: Scope Added Without Change Orders
The crew does additional work — at the owner's request, to fix a problem, or because the foreman made a judgment call — and the hours get absorbed into the project without a corresponding change order. Three weeks of extra work later, the labor cost report shows an overrun that's actually compensable scope that was never billed.
Document all extra scope immediately with a written change order request. Hours absorbed without documentation become unrecoverable losses.
Proper documentation using photo documentation for contractors protects recoverable labor hours:
Root Cause 3: Overtime Not Caught in Time
A crew running 4 hours of overtime per week on a 12-week project accumulates 48 hours of overtime — 1.5× wages on 48 hours per worker. On a 10-person crew at $32/hour average wage, that's $23,040 in unplanned overtime cost. If overtime isn't flagged until payroll is processed, it's already happened.
Real-time construction employee time tracking shows overtime approaching before it's incurred — not after.
Using GPS timesheets for contractors allows you to monitor hours before overtime triggers:
Root Cause 4: Labor Hours Miscoded to Wrong Projects
On multi-project operations, hours get assigned to the wrong job — intentionally (workers padding a time-and-material project) or accidentally (foreman fills out the wrong job number). The actual job loses hours that don't show up in its cost report; another job absorbs costs it shouldn't carry. Both job cost reports are wrong.
GPS-verified clock-ins matched to job site geofences eliminate most miscoding. If the worker clocked in inside Job A's geofence, the hours go to Job A — there's no manual assignment to get wrong.
A structured project management software for general contractors reduces miscoding by connecting GPS location to job site selection
Root Cause 5: Discovery Too Late to Recover
This is the most expensive root cause — not the overrun itself, but the late discovery. A labor overrun found in week 2 of a 10-week project has 8 weeks of recovery opportunity: add workers, resequence, find efficiencies, submit a change order for legitimate scope additions. The same overrun found in week 8 has 2 weeks of recovery opportunity. Most of the damage is already done
The Real-Time Labor Tracking System
Step 1: Connect Time Tracking to Job Costing
A contractor time tracking app that records hours but doesn't connect to job costing is a payroll tool, not a cost control tool. The connection is simple: when workers clock in, they select a project and a cost code. That selection routes their hours to the correct budget line in the job cost system.
What the worker sees at clock-in:
- Tap clock-in
- Select job (Job A — Main Street Renovation)
- Select cost code (06-L Framing Labor)
- GPS verifies location
- Clock-in complete — 15 seconds
What the system records:
- Worker ID, timestamp, GPS coordinates
- Hours accumulating against Job A / 06-L Framing Labor
- Real-time budget remaining on that cost code
Step 2: Build the Budget Baseline
Before the project starts, enter your estimate's labor budget by cost code into the job cost system:
|
Cost Code |
Description |
Budgeted Hours |
Budgeted Cost |
|
01-L |
Supervision |
120 hrs |
$6,000 |
|
03-L |
Concrete labor |
180 hrs |
$7,560 |
|
06-L |
Framing labor |
420 hrs |
$16,380 |
|
09-L |
Finish labor |
310 hrs |
$13,020 |
|
15-L |
Mechanical rough-in |
140 hrs |
$7,700 |
|
16-L |
Electrical rough-in |
160 hrs |
$8,800 |
|
Total |
|
1,330 hrs |
$59,460 |
This is your labor budget. Every hour your crew works posts against it in real time.
Step 3: Run the Weekly Budget-vs.-Actual Review
Every Monday morning, pull the job cost labor report for the prior week. This review takes 15–20 minutes per active project and is the single highest-value time investment in project financial management.
What to look for:
Hours burned vs. percent complete: If a cost code is 50% of its budgeted hours spent but only 35% of the scope is complete, the productivity rate is running below estimate. The cost code is trending over budget.
Estimated cost at completion: Divide hours to date by percent complete to forecast total hours at completion.
- Budget: 420 framing hours
- Hours spent to date: 210 (50% of budget)
- Estimated % complete: 40%
- Projected total: 210 ÷ 0.40 = 525 hours — 105 hours over budget
At $39/hour burden rate, that's $4,095 of unplanned labor cost on framing alone. Caught in week 4 of a 10-week project — 6 weeks of recovery time available.
Missing hours: Cost codes where work is happening but no hours are posting indicate a tracking failure — workers forgetting to clock in, wrong job selected, foreman not enforcing the process. Missing hours mean the cost code's apparent performance is better than reality.
Early Warning: Catching Overruns While Recovery Is Still Possible
The value of construction time tracking isn't the historical record — it's the early warning. Here's what recovery looks like at different detection points on a 12-week, $750,000 project:
Overrun detected in Week 2 (16% complete):
- Unplanned cost incurred: ~$8,000
- Remaining project: 10 weeks
- Recovery options: Resequence scope, add crew to compressed phases, submit change order for legitimate extras, renegotiate sub scope, find material substitutions
- Probability of full recovery: High
Overrun detected in Week 6 (50% complete):
- Unplanned cost incurred: ~$25,000
- Remaining project: 6 weeks
- Recovery options: Limited resequencing, some overtime management, submit pending change orders
- Probability of full recovery: Medium
Overrun detected in Week 10 (83% complete):
- Unplanned cost incurred: ~$40,000
- Remaining project: 2 weeks
- Recovery options: Accept the loss, preserve remaining margin on punch list
- Probability of full recovery: Low
Overrun detected at final billing (100% complete):
- Full loss recognized, zero recovery options
- Impact flows directly to net profit
The same $40,000 overrun has dramatically different outcomes depending on when you find it. Real-time labor tracking shifts discovery from week 10 or final billing to week 2.
Production Rate Tracking
Labor hours alone don't tell the full story. A cost code that's 60% spent but 55% complete might be a minor efficiency issue — or it might be a serious problem with one bad week mixed in with mostly good weeks. Production rate tracking adds the second dimension.
Production rate = units completed per labor hour
Track this weekly alongside labor costs:
|
Phase |
Unit |
Budget Rate |
Week 1 |
Week 2 |
Week 3 |
Trend |
|
Framing |
SF/hour |
45 SF/hr |
44 SF/hr |
38 SF/hr |
31 SF/hr |
Worsening |
|
Drywall hang |
sheets/hour |
8 sheets/hr |
8.2 |
7.9 |
8.1 |
On track |
|
Tile |
SF/hour |
12 SF/hr |
11.5 |
11.8 |
9.2 |
Investigate |
A production rate trending downward week over week is a leading indicator of a growing labor overrun — it shows the problem before the budget variance is large enough to trigger a flag.
Root cause investigation when production drops:
.jpg?width=600&height=450&name=2%20(43).jpg)
- Design issues — scope is more complex than planned
- Rework — quality problem requiring tear-out and redo
- Trade stacking — crews impeding each other
- Material delays — crew waiting for materials
- Crew composition — wrong skill mix for the work
Each root cause has a different resolution. You can't find the root cause without production rate data — and you can't get production rate data without accurate construction employee time tracking connected to scope completion milestones.
How Time Tracking Data Improves Future Estimates
Every project's actual labor hours are a data point for your next estimate. Contractors who track labor accurately build an estimating database of actual productivity rates from their own projects — far more reliable than industry averages.
Building your productivity database:
After every project closes, record:
- Actual hours by cost code
- Units completed (square feet, linear feet, cubic yards)
- Actual production rate
- Variance from estimate: over or under, and documented reason
After 10–15 similar projects, you have production rates that reflect your crew's actual skill level, your market's typical site conditions, your management approach, and seasonal adjustments. A framing estimate built on 3 years of your own tracked data will be more accurate than one built on RS Means national averages.
The WIP Report Connection
Your Construction WIP Report uses estimated cost at completion as its primary input. That estimate comes directly from your job cost labor tracking. When labor hours are tracked in real time:
- Estimated cost at completion updates weekly
- Over/under billing calculation stays current
- WIP-adjusted P&L reflects actual project financial position
When labor hours are tracked with a 2-week lag or estimated from memory:
- Estimated cost at completion is stale
- WIP schedule is wrong
- Your bonding company and bank are seeing inaccurate financial statements
A surety reviewing your WIP schedule wants to see estimates at completion being updated as projects progress. Stale cost data signals weak financial controls — and can affect your bonding capacity. See Construction Bonds Guide.
ROI of Real-Time Labor Tracking
Conservative scenario — $3M revenue contractor, 40% labor cost:
|
Metric |
Without Real-Time Tracking |
With Real-Time Tracking |
|
Annual labor cost |
$1,200,000 |
$1,200,000 |
|
Labor overrun rate |
8% of labor budget |
3% of labor budget |
|
Annual overrun cost |
$96,000 |
$36,000 |
|
Annual savings |
— |
$60,000 |
|
Software cost (25 users × $10/mo) |
$3,000/year |
$3,000/year |
|
Admin time saved (8 hrs/cycle × 26 cycles × $25/hr) |
— |
$5,200/year |
|
Net annual benefit |
— |
$62,200 |
|
ROI |
— |
20× |
The 8% → 3% overrun rate improvement is conservative — contractors who implement real-time tracking and weekly review typically report overrun reductions of 50–70% in the first year.
Setting Up the System: Step by Step
Week 1: Configuration
- Set up projects in your construction time tracking app with cost codes matching your estimate structure
- Enter labor budget by cost code for each active project
- Configure geofences for each job site
- Connect time tracking export to your job cost software (QuickBooks, Sage, Procore, etc.)
Week 2: Field training
- Train workers on project + cost code selection at clock-in
- Train foremen on approving daily time entries
- Establish: all time approved by 9am the following day
Week 3: First review cycle
- Pull budget-vs.-actual labor report after first full week
- Expect data quality issues — missing clock-ins, wrong cost codes, geofence errors
- Correct at the source; adjust process, not the data
Month 2 onward:
- Weekly 20-minute job cost labor review for every active project
- Flag any cost code over 105% of pace (hours spent ÷ % complete)
- Investigate immediately — don't wait for the next week's report
- Document root causes for every significant variance
Labor Cost Overrun Prevention Checklist
Before project starts:
- [ ] Labor budget entered by cost code in job cost system
- [ ] Cost codes configured in time tracking app for this project
- [ ] Geofence set for job site
- [ ] All workers assigned to project in app
- [ ] Burdened labor rates updated (wages + taxes + workers comp + benefits)
Weekly during project:
- [ ] All labor hours posted and approved within 24 hours
- [ ] Budget-vs.-actual labor report pulled every Monday
- [ ] Estimated cost at completion calculated for each in-progress cost code
- [ ] Any code over 105% of pace flagged and investigated
- [ ] Overtime approaching 35+ hours flagged and managed
- [ ] Production rates tracked alongside hours
At project close:
- [ ] Final actual hours by cost code documented
- [ ] Actual vs. estimated variance analyzed with root cause notes
- [ ] Production rates recorded in estimating database
- [ ] WIP report updated to reflect final costs
Weekly Budget vs. Actual Review (The 20-Minute Profit Habit)
Every Monday:
- Pull labor cost report
- Compare hours spent vs. percent complete
- Forecast estimated cost at completion
- Flag any cost code running over 105% of pace
This one review habit reduces overruns more than any other operational change.
To explore built-in budget tracking features:
Explore TaskTag Construction Software
Production Rate Tracking: The Early Warning System
Tracking hours alone is not enough.
You must track:
Production Rate = Units Completed ÷ Labor Hours
If production declines week over week, you have:
- Rework
- Trade stacking
- Material delays
- Skill mismatch
- Design complexity issues
Production data tied to structured photo logs improves visibility dramatically: Photo Documentation for General Contractors
How Time Tracking Improves Future Estimates
Every completed project becomes estimating intelligence.
When you track:
- Actual hours by cost code
- Units completed
- Variance reasons
You build a real productivity database.
Over time, your estimates reflect your crew — not national averages.
Contractors who combine real-time tracking with structured workflows using tools built for contractor workflows improve estimating accuracy significantly:
The WIP Report Connection
Your WIP report depends on accurate cost-to-complete projections.
If labor hours are delayed:
- WIP becomes inaccurate
- Bonding capacity can suffer
- Financial statements misrepresent reality
For deeper operational strategy insights, review additional construction management resources:
ROI of Construction Time Tracking Software
For a $3M contractor:
- Labor cost: $1.2M annually
- Typical unmanaged overrun: 8%
- With real-time tracking: ~3%
That’s a $60,000 annual swing in margin.
Most contractors see a 10–20× return on software investment within the first year.
If you want to evaluate cost structure directly: TaskTag Pricing Plans
You can also compare platforms:
TaskTag vs CompanyCam Comparison
Implementation Plan (Simple & Practical)
Week 1 – Setup
- Enter projects
- Add labor budgets by cost code
- Configure geofences
- Connect to accounting system
Week 2 – Field Training
- Train crew on project + cost code selection
- Require daily approvals
- Enforce 24-hour time posting
Week 3 – First Review
- Pull labor report
- Expect minor errors
- Correct process, not just data
If you'd like to see how other contractors implemented similar systems:
Residential Contractor Success Story
Construction Delivery Tracking Case Study
Final Takeaway
Labor overruns rarely happen suddenly.
They happen gradually — and invisibly — until it’s too late.
Construction time tracking moves detection forward.
And in construction finance, earlier detection equals higher profit retention.
If you’re ready to implement real-time labor visibility:
Start Your Free TaskTag Account
Related Resources
TaskTag Features and Comparisons
- GPS Time Tracking for Construction — real-time labor tracking connected to job cost codes
- Construction Time Tracking Software Guide — software with job costing integration
- Time Tracking for Construction Workers — field worker guide to cost code clock-in
- Top 5 Construction Time Tracking Apps — job costing integration comparison
- Top 5 BusyBusy Alternatives — apps with budget vs. actual labor tracking
- TaskTag vs. BusyBusy — job cost integration comparison
Related Blog Posts (internal — live after deployment)
- Construction WIP Report — how real-time labor data feeds WIP and balance sheet
- Contractor Profit and Loss Statement — how job cost labor rolls up to company P&L
- Construction Cash Flow Management — managing cash impact of labor overruns mid-project
- Construction Bonds Guide — how labor tracking accuracy affects bonding capacity
- Construction Project Delay — how labor overruns create schedule impacts and delay claims
- Construction Retainage — cash flow impact when labor overruns compress margin