 A bad construction schedule doesn't just miss dates — it costs money every day it's wrong. Extended general conditions run $500–$5,000/day on commercial projects. Idle crews burn labor dollars without producing work. Subcontractors mobilize twice when sequencing breaks down. The contractor who controls the schedule controls the project's profitability — and the contractor who doesn't, argues about delay claims after the fact instead of preventing them.
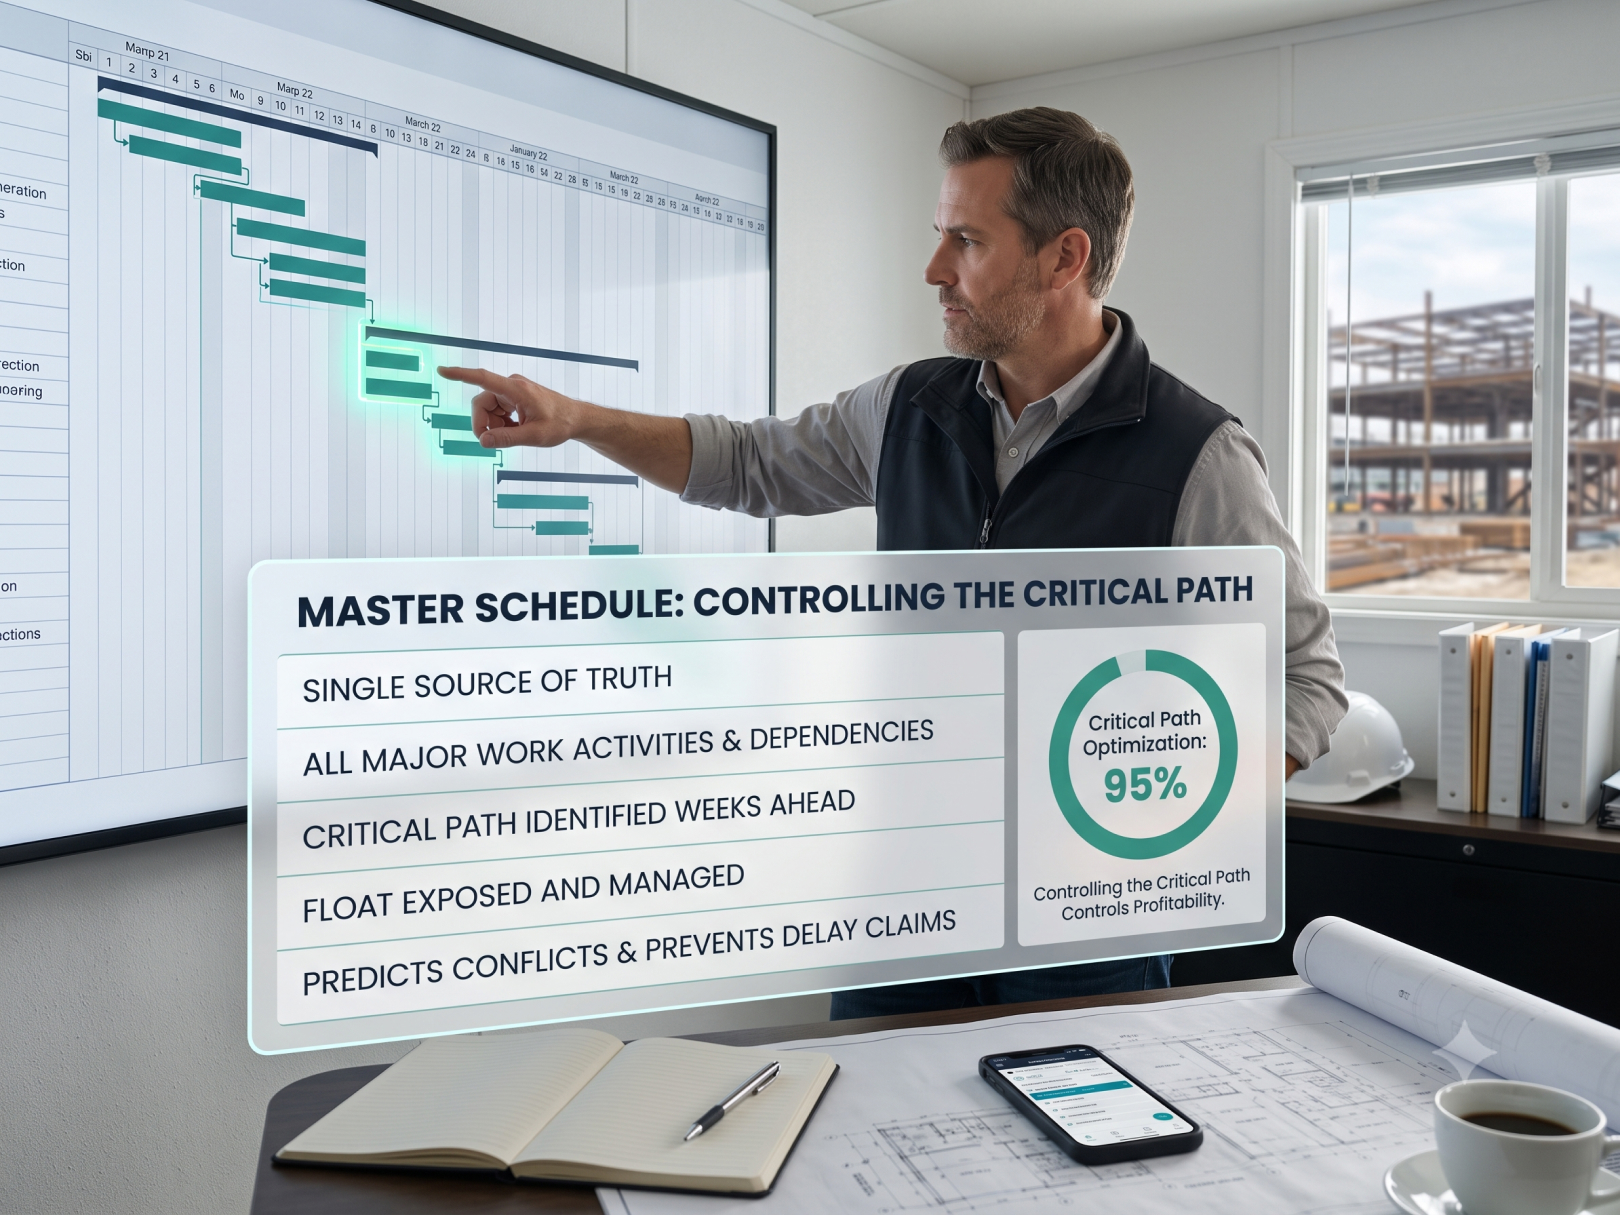
A master schedule is the single source of truth for when every scope item happens, who's responsible, what has to happen first, and what the critical path is. Built correctly, it exposes float, predicts conflicts weeks before they hit, and creates the documented baseline you need to support delay claims when the owner, architect, or a subcontractor blows a milestone.
This guide covers how to build a master schedule from first principles — work breakdown, sequencing, duration estimation, critical path identification, resource loading, and schedule maintenance — and how construction time tracking software feeds actual labor data back into the schedule to close the loop between planned and actual.
This guide explains how to build a master construction schedule from first principles. It covers work breakdown structure, dependencies, duration estimates, critical path, resource loading, procurement, schedule updates, and how GPS timesheets for contractors help connect field labor data to the schedule.
What a Master Schedule Actually Is
Master schedule = project-level schedule showing all major work activities, milestones, dependencies, and the critical path from Notice to Proceed to Substantial Completion.
Not the same as:
- 3-week lookahead: Subcontractor-level detail for the next 3 weeks. Drives daily coordination — pulled from the master schedule, not a replacement for it.
- Submittal schedule: Tracks shop drawings, submittals, and RFI responses. Feeds into the master schedule but lives separately.
- Procurement schedule: Long-lead equipment and material delivery dates. Also feeds in.
The master schedule sits at the top. It sets the framework. Everything else integrates under it.
Contractors using project management software for general contractors can keep schedule updates, field notes, jobsite photos, and team communication easier to reference throughout the project.
Step 1: Work Breakdown Structure
Before any dates, build the Work Breakdown Structure (WBS) — the complete list of scope items organized into a logical hierarchy.
WBS hierarchy for a commercial project:
Project ├── Phase 1: Site Work │ ├── Demolition │ ├── Earthwork / Grading │ ├── Underground Utilities │ └── Paving ├── Phase 2: Foundation │ ├── Excavation │ ├── Formwork │ ├── Rebar │ ├── Concrete Placement │ └── Waterproofing ├── Phase 3: Structure │ ├── Steel Erection │ ├── Metal Decking │ └── Concrete on Deck ├── Phase 4: Enclosure │ ├── Exterior Wall Framing │ ├── Roofing │ └── Exterior Glazing ├── Phase 5: MEP Rough-In │ ├── Mechanical Rough-In │ ├── Electrical Rough-In │ └── Plumbing Rough-In ├── Phase 6: Interior Build-Out │ ├── Interior Framing │ ├── Insulation │ ├── Drywall │ ├── Painting │ └── Flooring ├── Phase 7: MEP Trim-Out │ ├── Mechanical Trim │ ├── Electrical Trim │ └── Plumbing Trim ├── Phase 8: Finishes │ ├── Ceilings │ ├── Millwork / Casework │ └── Specialty Items └── Phase 9: Closeout ├── Punch List ├── Inspections / Certificate of Occupancy └── Owner Training / Commissioning The WBS becomes the activity list in your scheduling software. Every activity in the master schedule maps to a WBS element. No activity without a WBS parent — and no WBS element without activities.
Step 2: Identify Dependencies
Once all activities are listed, define the relationships between them. No schedule runs without correct logic.
Dependency Types
Finish-to-Start (FS): Activity B can't start until Activity A is complete.
- Concrete placement can't start until rebar is complete.
- Drywall can't start until MEP rough-in is complete.
Start-to-Start (SS): Activity B can't start until Activity A starts.
- Framing and rough MEP often run SS — MEP starts shortly after framing starts.
Finish-to-Finish (FF): Activity B can't finish until Activity A finishes.
- Punch list and commissioning often run FF — both must complete before CO is issued.
Lag: Deliberate time between two activities.
- Concrete placed → 28 days lag → formwork strip (cure time).
- Paint complete → 3 days lag → flooring install (dry time).
Lead (negative lag): Overlap between activities.
- Roofing doesn't have to be 100% complete before interior framing begins — 50% roofing + lead allows overlap.
Common Sequencing Mistakes
- Missing dependencies: Activities show parallel that can't run parallel (e.g., drywall before MEP inspection).
- Hard-coded dates instead of logic: Pinning activities to calendar dates instead of predecessors. When one activity shifts, hard-coded dates don't move with it.
- Missing external dependencies: Owner-furnished equipment delivery, utility company work, permit approval — these must be in the schedule as activities or milestones with assigned owners.
Step 3: Estimate Durations
Duration estimation for each activity requires three inputs: scope quantity, production rate, and crew size.
Duration formula:
Duration (days) = Quantity / (Daily Production Rate × Crew Size) Example — framing 10,000 SF of metal stud interior partitions:
- Quantity: 10,000 SF
- Production rate: 400 SF/crew/day (typical metal stud framing)
- Crew size: 4 framers
- Duration = 10,000 / (400 × 4) = 6.25 days → round to 7 working days
Where production rates come from:
Historical data from past projects is the most accurate source. A contractor whose construction time tracking app captures hours by cost code has actual production rate data — not RS Means estimates, not gut feel. GPS-verified construction time tracking records show exactly how many field hours it took to complete a given quantity of work on previous projects. That data becomes the production rate input for the next project's schedule.
Productivity factors that affect duration:
- Floor level (production slows above 3rd floor)
- Weather (exterior work in winter)
- Learning curve (first iteration of repeating floor plan vs. 10th)
- Crew experience with specific scope
Build productivity factors into your durations, not as surprises after the fact.
A contractor using construction time tracking resources can review actual hours by project, worker, and cost code. This helps project managers understand how long similar work took on previous jobs.
Step 4: Build the Critical Path
.jpg?width=600&height=450&name=3%20(57).jpg)
The critical path is the longest path through the network of activities — the sequence of activities that determines the minimum project duration. Any delay on a critical path activity delays the project's end date by the same amount.
Float (total float): How many days an activity can be delayed before it affects the project end date. Activities on the critical path have zero float.
Critical path calculation: Every scheduling tool (Primavera P6, Microsoft Project, Procore, etc.) calculates the critical path automatically once activities, durations, and dependencies are entered.
Forward pass: Calculates Early Start (ES) and Early Finish (EF) for each activity, working forward from project start.
Backward pass: Calculates Late Start (LS) and Late Finish (LF) for each activity, working backward from project end.
Float = Late Start − Early Start (or Late Finish − Early Finish)
What to do with the critical path:
- Assign maximum management attention to critical path activities — any slip here is a project slip.
- Look for crash opportunities — if the end date is too late, compress the critical path by adding resources (crashing) or overlapping activities (fast-tracking).
- Monitor float consumption — an activity that starts with 5 days of float and is now at 2 days is heading toward critical. Act before it reaches zero.
Step 5: Resource Load the Schedule
A schedule that doesn't account for resource constraints isn't a schedule — it's a wish list. Resource loading answers: do we have enough people, equipment, and money to execute this schedule as planned?
Labor Resource Loading
For each activity:
- Assign craft type (carpenter, ironworker, electrician, etc.)
- Assign crew size
- Calculate total labor hours (duration × crew size × hours/day)
When the schedule is resource-loaded, you can see peak labor demand by week or month. If the schedule shows 35 carpenters needed in week 14 and you can only staff 20, the schedule must be adjusted — before week 14, not during it.
Construction crew time tracking connects resource planning to reality: When actual crew sizes and hours are tracked against the cost code matching each scheduled activity, the PM can compare planned vs. actual resource consumption in real time. An activity planned for 4 carpenters running 8 days that's showing only 2 carpenters on the construction time clock app is behind — visible before it becomes a schedule variance.
Equipment Resource Loading
Same concept — list equipment needed per activity. A tower crane that's needed for steel erection and concrete pours simultaneously is a conflict to resolve in the schedule, not on the job site.
Cash Flow Loading
Load contract amounts against scheduled activities to produce a cash flow projection by period. See Construction Cash Flow Management for integrating schedule-based cash flow into financial management. The WIP report (Construction WIP Report) uses the schedule's percent complete as the basis for over/under billing analysis.
Contractors can use jobsite photos and daily progress tracking to support what happened on site, when it happened, and whether critical path work was delayed.
Step 6: Identify and Manage Long-Lead Items
Every project has activities that can't start until something is purchased, fabricated, or delivered — and that fabrication or delivery takes months.
Common long-lead items:
- Structural steel: 12–20 weeks
- Elevator equipment: 16–26 weeks
- Custom glazing systems: 16–24 weeks
- Switchgear / generators: 20–40 weeks
- HVAC equipment (chillers, rooftop units): 12–24 weeks
- Custom casework / millwork: 8–16 weeks
Plot long-lead procurement as a parallel track in the master schedule. The procurement milestone (purchase order issued) must happen early enough that delivery lands before the field activity needs the material. Missing a long-lead delivery is one of the most common causes of critical path delays — and one that must be documented carefully for potential delay claims.
Teams that need better visibility into materials, deliveries, and field coordination can review this construction delivery tracking case study.
Schedule Formats
.jpg?width=600&height=450&name=3%20(58).jpg)
Gantt Chart: Horizontal bar chart showing activities against a calendar timeline. Best for owner communication and field team use. Most scheduling software outputs Gantt by default.
Precedence Diagram Method (PDM): Network diagram showing activities as nodes and dependencies as arrows. Best for understanding logic relationships and identifying critical path. Primavera P6 and MS Project use PDM logic under the hood.
Linear Schedule (Time-Distance): For repetitive linear work — road projects, pipeline, multi-story buildings with repeating floors. Shows location on one axis and time on the other.
For most commercial GCs: Gantt with underlying PDM logic, produced in Primavera P6, MS Project, or Procore Scheduling, is standard.
Schedule Maintenance: Updating the Master Schedule
A schedule built at project start and never updated is a historical document, not a management tool. Schedules require regular updates.
Update frequency:
- Weekly: 3-week lookahead (subcontractor-level detail)
- Monthly: Master schedule update — actual start/finish dates, remaining durations, forecast completion
- After any significant change: Change orders that affect critical path, major delays, owner-directed scope changes
Update process:
- Collect actuals — actual start dates, actual finish dates, percent complete for in-progress activities
- Update remaining durations based on actual progress vs. planned
- Recalculate critical path and float
- Identify any activities that have consumed float and are now critical or near-critical
- Issue updated schedule with change narrative
Where construction timesheet app data feeds the update:
Hours logged by cost code in the contractor time tracking app map directly to scheduled activities. When the PM updates percent complete on an activity, they can compare planned hours (from the resource-loaded schedule) to actual hours (from the time tracking system). An activity that's 50% complete but has consumed 70% of its planned hours is running inefficient — the remaining duration estimate needs to increase. Catching this at the 50% mark is recoverable. Missing it until 90% is a schedule crisis.
Forensic scheduling: If a delay dispute arises, the schedule update history — combined with GPS-verified daily labor records from the construction time keeping app — creates a contemporaneous record of what happened and when. See Construction Project Delay for how to document and pursue delay claims.
Contractors comparing field documentation options can review the TaskTag vs CompanyCam comparison to see how construction teams can manage photos, communication, and documentation in one workflow.
Schedule Compression: When You're Behind
When the schedule shows a late completion, two options exist: crash or fast-track.
Crashing: Add resources to critical path activities to shorten their duration.
- Cost: Overtime, additional crew, additional equipment
- Limit: Some activities can't be shortened regardless of resources (concrete cure time, inspections, permit turnaround)
- Decision: Compare crash cost vs. cost of delay (extended general conditions, liquidated damages, lost float)
Fast-tracking: Run activities in parallel that were planned sequentially.
- Risk: Increased coordination, potential rework if earlier activity changes affect later activity
- Common fast-tracks: Start interior framing before roofing is 100% complete; start MEP rough-in by zone as framing completes rather than waiting for all framing to finish
What not to do: Remove logic from the schedule to make it look compliant when it isn't. A schedule with missing predecessors and unrealistic remaining durations satisfies no one — and creates liability when the project doesn't finish on time and the documented schedule showed on-time completion.
TaskTag helps contractors organize field photos, time records, daily reports, and project communication in one place. If your team wants better schedule visibility from the field, you can create a free contractor account or schedule a construction software demo.
Keep Construction Schedules Connected to the Field
Build stronger schedules with real jobsite data, photos, time records, and daily field updates.
With TaskTag, contractors can track progress from the field and keep project teams aligned from planning through closeout.
Scheduling Software Options
|
Tool |
Best For |
Notes |
|---|---|---|
|
Primavera P6 |
Large commercial/public projects |
Industry standard for large GCs, complex logic, resource loading |
|
Microsoft Project |
Mid-size commercial |
Widely used, integrates with Microsoft ecosystem |
|
Procore Scheduling |
GCs already on Procore |
Integrated with RFIs, submittals, daily reports |
|
Buildertrend |
Residential / smaller commercial |
User-friendly, lower learning curve |
|
Smartsheet |
Simpler projects, PM-focused teams |
Gantt + collaboration, not as powerful for critical path |
For most commercial GCs: Primavera P6 (large projects) or MS Project (mid-size) connected to Procore for field management is the standard stack.
Master Schedule Checklist
Schedule build:
- [ ] WBS complete — all scope items captured
- [ ] All activities have durations based on quantity and production rate
- [ ] All predecessor/successor relationships defined — no free-floating activities
- [ ] Long-lead procurement activities plotted as separate track
- [ ] External dependencies identified with assigned owners (permit, utility company, owner-furnished equipment)
- [ ] Critical path identified and reviewed with project team
- [ ] Float values reviewed — no activities with unrealistically high float (missing logic)
- [ ] Resource loading complete — peak demand periods identified and resolved
Schedule maintenance:
- [ ] Monthly update process defined — who collects actuals, who updates the schedule, when it's issued
- [ ] As-built dates recorded for all completed activities
- [ ] Change orders with schedule impact assessed and incorporated
- [ ] 3-week lookahead issued weekly at subcontractor coordination meeting
- [ ] Float consumption tracked — activities losing float flagged for management attention
Related Resources
TaskTag Features
- GPS Time Tracking for Construction — real-time labor data that feeds schedule percent-complete calculations
- Construction Time Tracking Software — hours-by-cost-code data for production rate analysis and schedule updates
- Time Tracking for Construction Workers — field time records that close the loop between planned and actual schedule performance
- Top 5 Construction Time Tracking Apps — time tracking app comparison for schedule integration
- Top 5 BusyBusy Alternatives — alternatives with cost code tracking for schedule cost loading
- TaskTag vs. BusyBusy — schedule integration comparison
Related Blog Posts
- Construction Project Delay — delay claims when schedule milestones are missed
- Construction Cash Flow Management — schedule-based cash flow projections
- Construction WIP Report — percent complete from schedule feeding WIP billing position
- Construction Retainage — milestone-based retainage release tied to schedule
- How to Negotiate a Construction Contract — liquidated damages and schedule requirements in contract negotiation
- Construction Project Closeout — closeout milestones as the final schedule phase
.jpg?height=200&name=1%20(15).jpg)