


Labor is typically 30–50% of total construction project cost — and the category with the highest...
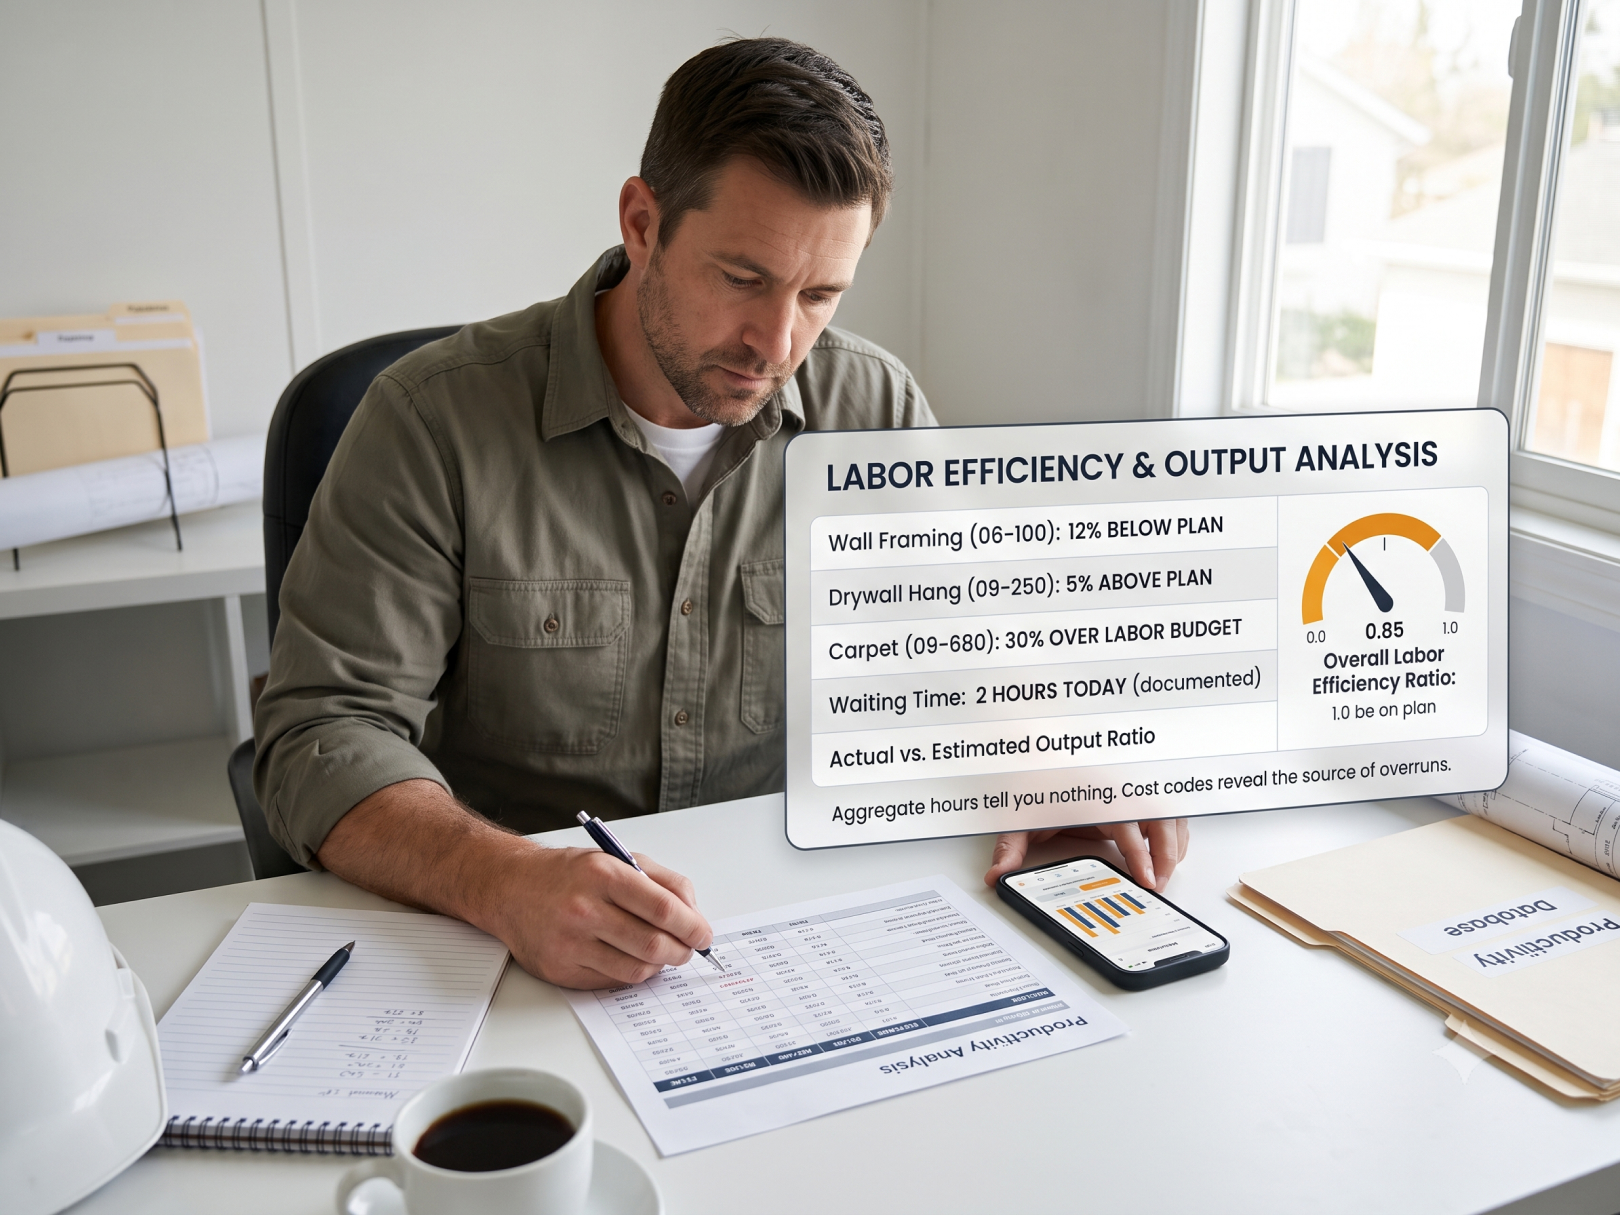 Low labor productivity is the hidden margin killer in construction. A project where workers are present and billing hours but delivering 70% of estimated output is losing 30% of its labor budget to waste — without a single error on an invoice, a cost code overrun alert, or a red flag on the weekly report. The work is getting done. It's just taking 30% longer than it should, at full burdened rate.
Industry studies consistently show that construction field workers spend only 30–50% of their paid time on direct productive work. The rest goes to waiting for materials or equipment, traveling on site, rework, crew coordination, and idle time that's invisible in aggregate hour totals. A construction time tracking app that captures hours by cost code gives a contractor the data to see where hours actually go — not where they were supposed to go.
This guide covers how to define and measure labor productivity at the cost code level, what drives productivity loss on construction sites, how to use historical time tracking data to build a productivity database, and specific tactics that improve output per labor hour without adding crew or hours.
What Labor Productivity Means in Construction
Labor productivity = units of completed work per labor hour
It's not effort — it's output. A crew that works hard for 8 hours and installs 400 SF of tile has the same productivity as a crew that works efficiently for 6 hours and installs 400 SF. The first crew may be working harder; only the second is working productively.
This definition matters because productivity measurement in construction often defaults to "are workers busy?" rather than "how much are workers completing?" A busy crew moving materials, waiting for an inspection, and searching for tools is generating hours and zero installed work.
The two components of labor productivity:
- Production rate: How fast work can be installed under good conditions — the ceiling.
- Labor efficiency ratio: How close actual performance comes to the production rate ceiling — the gap.
Labor efficiency ratio = Estimated hours for completed work ÷ Actual hours charged
- Ratio > 1.0: More efficient than estimated (good — but check if estimate was conservative)
- Ratio = 1.0: On plan
- Ratio < 1.0: Less efficient than estimated (find out why)
A framing crew with an estimated production rate of 45 SF/hour that's delivering 36 SF/hour has a labor efficiency ratio of 0.80 — 20% below plan. On a 10,000 SF framing scope, that's 28 extra labor hours at full burdened cost.
Measuring Productivity at the Cost Code Level
Aggregate project labor hours are nearly useless for productivity management. "We spent 1,200 hours on this project" tells you nothing about whether framing was efficient, drywall was slow, or tile ran over budget.
Cost-code-level hour tracking is the minimum requirement for productivity measurement. When workers clock in with both project and cost code selection, actual hours accumulate by scope category — creating the denominator in the production rate calculation.
Weekly productivity tracking by cost code:
|
Code |
Scope |
Est. Rate |
Qty Done This Week |
Est. Hrs |
Act. Hrs |
Efficiency |
|---|---|---|---|---|---|---|
|
06-100 |
Wall framing |
45 SF/hr |
2,800 SF |
62.2 |
71.0 |
0.88 |
|
09-250 |
Drywall hang |
9 sheets/hr |
140 sheets |
15.6 |
14.8 |
1.05 |
|
09-680 |
Carpet |
280 SF/hr |
1,600 SF |
5.7 |
8.2 |
0.70 |
|
09-310 |
Tile |
11 SF/hr |
480 SF |
43.6 |
44.1 |
0.99 |
Two problems jump out immediately: framing running 12% below plan, carpet running 30% below plan. Both are visible within the week they occur — not at project closeout. The superintendent can investigate before the overrun compounds.
This visibility requires a construction time clock app that captures cost codes at clock-in, not just total project hours. Workers who clock into "Project 47" without specifying the cost code produce aggregate hours — the tool produces cost-code hours. The difference is the difference between knowing there's a labor overrun and knowing where it is.
Productivity Benchmarks by Trade
Published benchmarks give a starting reference point — your actual rates will differ based on market, crew, and project conditions:
|
Trade / Scope |
Benchmark Range |
Notes |
|---|---|---|
|
Wood framing — platform |
35–65 SF/hr |
Story height, complexity, opening density |
|
Steel stud framing |
45–75 SF/hr |
Gauge, height, access |
|
Concrete formwork — walls |
2–5 SF/hr |
Form type, reuse factor |
|
Concrete placement — slab |
10–20 CY/hr |
Pump vs. direct, mix design |
|
CMU block |
8–14 SF/hr |
Bond pattern, reinforcing, height |
|
Drywall hang |
7–11 sheets/hr |
Ceiling vs. wall, room size |
|
Drywall finish |
400–700 SF/hr |
Coat count |
|
Ceramic tile — floor |
8–15 SF/hr |
Size, pattern, substrate condition |
|
Ceramic tile — wall |
6–10 SF/hr |
Height, cut complexity |
|
Carpet — direct glue |
200–350 SF/hr |
Room configuration |
|
Painting — roller |
200–350 SF/hr |
Surface prep included or separate |
|
EMT conduit — 3/4" |
20–35 LF/hr |
Concealed vs. exposed, height |
|
Copper pipe — 1/2" soldered |
15–25 LF/hr |
Access, joint count |
|
HVAC ductwork — rectangular |
40–80 lbs/hr |
Gauge, fittings complexity |
Industry benchmarks are averages across all markets and conditions. Your own historical averages — built from construction employee time tracking data across completed projects — are more accurate for your estimates and more useful for productivity management.
What Kills Productivity on Construction Sites
.jpg?width=600&height=450&name=3%20(29).jpg)
Research on construction labor productivity consistently identifies the same root causes:
1. Waiting — The Biggest Productivity Killer
Waiting represents 10–20% of total field labor hours on most construction projects. Workers waiting for:
- Material deliveries that haven't arrived
- Inspections that haven't been called or that inspectors haven't arrived for
- Predecessor work from another trade that isn't complete
- Equipment that's on another site or broken
- Answers to RFIs or design questions
- Directions from foreman or superintendent
Waiting hours appear on the time sheet exactly like productive hours. The construction timesheet app that shows 8 hours charged to "rough framing" doesn't tell you whether those 8 hours were 8 hours of installation or 6 hours of installation plus 2 hours waiting for the structural engineer to approve a header size.
The only way to see waiting time is to track it — either through a specific "waiting" cost code or through daily report documentation of delays.
2. Material Handling and Searching
Field workers regularly spend significant time doing work that shouldn't require their skill level:
- Unloading and staging deliveries
- Moving materials from staging area to point of installation
- Searching for tools, materials, or equipment that aren't in the expected location
- Returning incorrect or damaged materials
Studies put material handling at 15–25% of field labor hours on average. Some of this is unavoidable — installation requires materials at the point of installation. But poor material staging, crowded job sites, and inadequate staging areas multiply this percentage.
3. Rework
Defect correction and rework runs 5–15% of project labor cost on average. Every hour spent correcting a mistake was also preceded by an hour spent making it — so rework effectively represents double labor cost on that scope. See Construction Defect Claims for the full cost picture of defects.
Rework causes:
- Design errors discovered mid-installation
- Coordination failures between trades (piping conflicts, structural conflicts)
- Poor-quality installation on first pass
- Changed owner requirements
- Damaged work requiring repair before cover-up
4. Crew Composition Mismatch
Putting a journeyman electrician on tasks that require a laborer — material handling, site cleanup — is burning skilled trade labor rates on unskilled work. Putting an apprentice on complex work that requires journey-level skill creates rework and slow production.
Optimal crew composition matches skill level to task requirement. Foremen who assign tasks based on "who's available" rather than "what skill does this task need" routinely produce inefficient crews.
5. Site Congestion and Access
On congested sites — multiple trades working in the same area, inadequate staging, poor traffic flow — workers spend time navigating around each other instead of installing. The problem is most acute on occupied renovation projects, phased construction, and projects with compressed schedules that push multiple trades into the same space simultaneously.
Building a Productivity Database from Time Tracking Data
The most valuable long-term outcome of construction crew time tracking is the historical productivity database it creates.
After every project closes:
- Pull actual hours by cost code from your time tracking system
- Pull actual quantities installed from the project record
- Calculate actual production rate: quantity ÷ actual hours
- Compare to estimated production rate: variance = (actual − estimated) ÷ estimated
- Record in your production rate database with project context notes
After 15–20 similar projects, you have statistically meaningful data:
|
Scope |
Avg Rate |
Std Dev |
Low |
High |
Projects |
|---|---|---|---|---|---|
|
Platform framing |
43.2 SF/hr |
4.8 |
36 |
52 |
14 |
|
CMU — standard bond |
10.1 SF/hr |
1.4 |
8.2 |
13.0 |
9 |
|
Tile — 12×12 floor |
11.8 SF/hr |
2.1 |
9.2 |
15.4 |
11 |
This table tells you three things:
- Your average rate for estimating
- The variance range — how much risk to build into the estimate
- What high performance looks like — and which projects achieved it
Using the data forward: When framing runs faster than average, investigate why — better crew composition, different project conditions, different material handling setup. When it runs slower, investigate the same variables. Pattern recognition across projects reveals the controllable factors that drive productivity up or down.
A contractor time tracking app that exports hours by cost code with project and date fields makes this database construction a post-project administrative task, not a field research project.
Productivity Improvement Tactics
Pre-Task Planning
Before starting each major scope, the foreman meets with the crew to cover:
- Exactly what work will be done today and this week
- Where materials are staged and how they'll be moved to point of installation
- What tools and equipment are needed and where they are
- What predecessor work must be verified complete before starting
- What inspection or quality checkpoints apply
Pre-task planning consistently produces 10–20% productivity improvement on the planned scope — primarily by eliminating the first-hour inefficiency of workers figuring out setup on their own.
Material Staging at the Point of Use
Material handling productivity loss is largely preventable with better logistics planning:
- Deliver materials as close to installation location as site conditions allow
- Pre-cut or pre-fabricate in a staging area rather than at point of installation
- Use material carts, hoists, and mechanized handling for heavy materials
- Stock adequate materials at the work face to avoid mid-shift trips to staging
For repetitive scopes (framing, drywall), the productivity difference between materials staged at the work face vs. staged at building entry can be 15–25%.
Crew Size Optimization
More workers is not always more productivity. On constrained scopes — tight rooms, narrow corridors, limited access — adding workers past the optimal crew size reduces output per worker because workers get in each other's way and the space limits simultaneous activity.
Optimal crew size depends on the workspace, not just the scope volume. A framing crew of 6 in a standard floor plate may be optimal; the same 6 workers in a tight mechanical room may produce less than 3 workers because of access constraint.
Track productivity by crew size on similar scope items over time. The data will show your optimal crew size for common scope types in your typical project conditions.
Overlapping Inspections
Waiting for inspections is one of the most consistent sources of idle labor time on building permit projects. Tactics:
- Call inspections the day before, not the morning of — many jurisdictions offer next-morning scheduling for previous-day calls
- Sequence inspection-dependent work so multiple inspections can occur in one visit
- Know which scopes require inspections and build inspection hold points into the schedule — don't assume continuous workflow
- Build relationships with inspectors; contractors known for clean work get faster turnaround
Minimize Trade Stacking
Putting multiple trades in the same space simultaneously produces coordination friction, safety constraints, and productivity loss for all trades involved. Sequence work to minimize overlap — rough MEP before framing closure, structural before MEP, exterior before interior.
When stacking is unavoidable, document the productivity impact in daily reports and in the project schedule as a basis for change orders if the stacking was owner-directed. See Construction Project Delay for the cost analysis framework.
Idle Time Identification and Reduction
.jpg?width=600&height=450&name=3%20(30).jpg)
Idle time is paid time with no installation output. Some idle time is legitimate (breaks, safety meetings, pre-task planning). Excess idle time is a cost with no corresponding value.
How to identify idle time patterns:
Cost code hours that significantly underrun estimated production — especially when scope appears to be progressing — often indicate idle time absorbed into the production code. A scope estimated at 40 hours that takes 55 hours with the same quantity installed has 15 hours of unproductive time somewhere in it.
Daily reports are the primary tool for documenting idle time causes. A construction time keeping software approach that includes a "delay" or "waiting" cost code lets workers log idle time directly — creating data that shows which causes are most frequent and most costly.
Most common idle time causes by frequency:
- Material not available at work face
- Waiting for inspection
- Waiting for preceding trade
- Equipment unavailable
- Weather (legitimate — but should be documented)
- RFI / design question hold
Each cause has a specific prevention approach. Material staging improvements reduce cause #1. Inspection scheduling protocol reduces cause #2. Subcontractor sequencing reduces cause #3. Equipment coordination reduces cause #4.
Productivity and the WIP Report
Labor productivity directly affects the project's financial position. When crews run below estimated productivity:
- Cost-to-complete increases (more hours needed to finish remaining scope)
- Percent complete calculations based on cost may overstate progress
- Projected final cost rises, reducing margin at completion
The Construction WIP Report should reflect productivity variances in real time. When cost-code tracking shows framing running at 85% efficiency for two weeks, the WIP cost-to-complete for framing should increase accordingly — not wait until the scope is done to discover the overrun.
A superintendent who reviews cost-code productivity weekly and updates the project's cost-to-complete forecast catches margin erosion early enough to respond. By the time the overrun shows up on an end-of-project P&L, the opportunity to recover it is gone.
See Contractor Profit and Loss Statement for how project-level productivity flows up to company P&L.
Productivity Tracking Checklist
Setup:
- [ ] Cost codes defined for all major scope items — not just one "labor" code per project
- [ ] Workers instructed on cost code selection at clock-in
- [ ] Foreman reviews and approves daily time by cost code before payroll
- [ ] Production rate targets documented per cost code for the project
Weekly:
- [ ] Actual production rate calculated per cost code (quantity ÷ actual hours)
- [ ] Labor efficiency ratio compared to estimate
- [ ] Cost codes running below 0.85 efficiency flagged for investigation
- [ ] Idle time / delay causes documented in daily reports
- [ ] WIP cost-to-complete updated to reflect actual productivity trend
Post-project:
- [ ] Actual production rates recorded by scope type with project context notes
- [ ] Productivity database updated
- [ ] High/low performance outliers investigated for root cause
- [ ] Lessons applied to next similar project estimate
Related Resources
TaskTag Features
- GPS Time Tracking for Construction — cost-code clock-in that captures actual hours per scope for production rate calculation
- Construction Time Tracking Software Guide — time data integration with productivity measurement and job costing
- Time Tracking for Construction Workers — field-level cost code tracking for productivity database building
- Top 5 Construction Time Tracking Apps — apps with cost code and production rate tracking features
- Top 5 BusyBusy Alternatives — productivity-focused time tracking alternatives
- TaskTag vs. BusyBusy — cost code and productivity tracking comparison
- Time Tracking for Landscapers — productivity measurement for landscape crews
Related Blog Posts
- Construction WIP Report — productivity variances in real-time WIP tracking
- Contractor Profit and Loss Statement — project productivity flowing to company P&L
- Construction Project Delay — productivity loss as a delay cost component
- Construction Defect Claims — rework as a productivity drain and defect liability
- How to Win More Construction Bids — productivity data as a competitive pricing advantage
- Construction Project Closeout — production rate recording as part of project closeout
- Construction Cash Flow Management — productivity overruns and their cash flow impact
-1.png?height=200&name=1%20(17)-1.png)